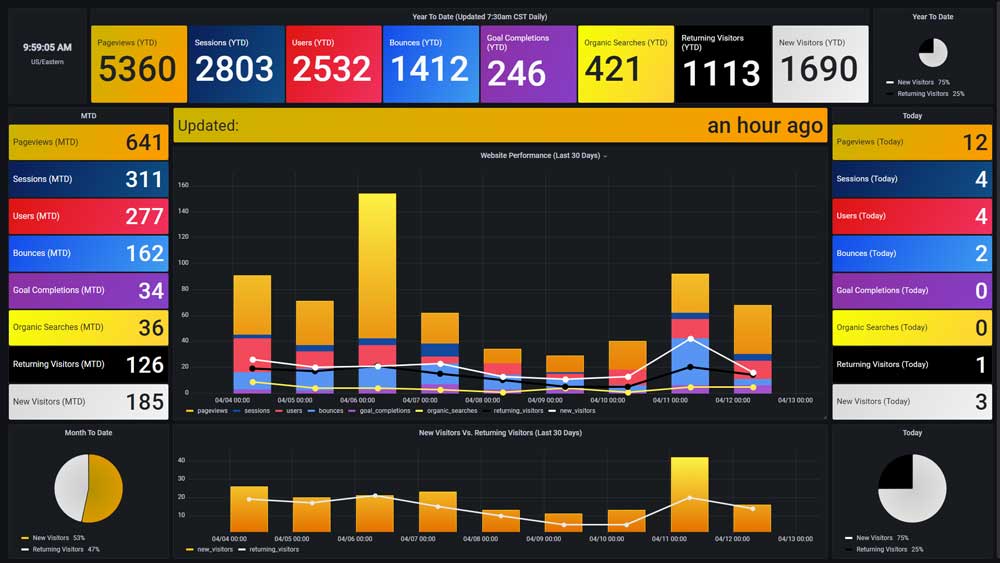
Google Analytics Real-Time Dashboard
Google Analytics is a crucial website/visitor performance tool used by the majorty of webmasters in operation today. It gives webmasters extremely detailed data regarding their webiste's popularity, performance and effectiveness over time. In addition to these details, Google Analytics gives webmasters the ability to generate reports and explore their data in detail; however, it's amazing in-depth granularity can be a bit of a drag due to its complexity and depth.
While Google Analytics is hugely advantageous to people who require detailed analytics on their Web properties, more often that not a user has to stop what they're' doing, navigate to the Google Analytics website, generate a report and then spend time studying that report.
The Google Analytics Real-Time Dashboard offers users a real-time view of their Web properties(s) simply by turning their head and looking at the screen.
The advantages of being updated on critical performance issues within seconds of events taking place cannot be understated.
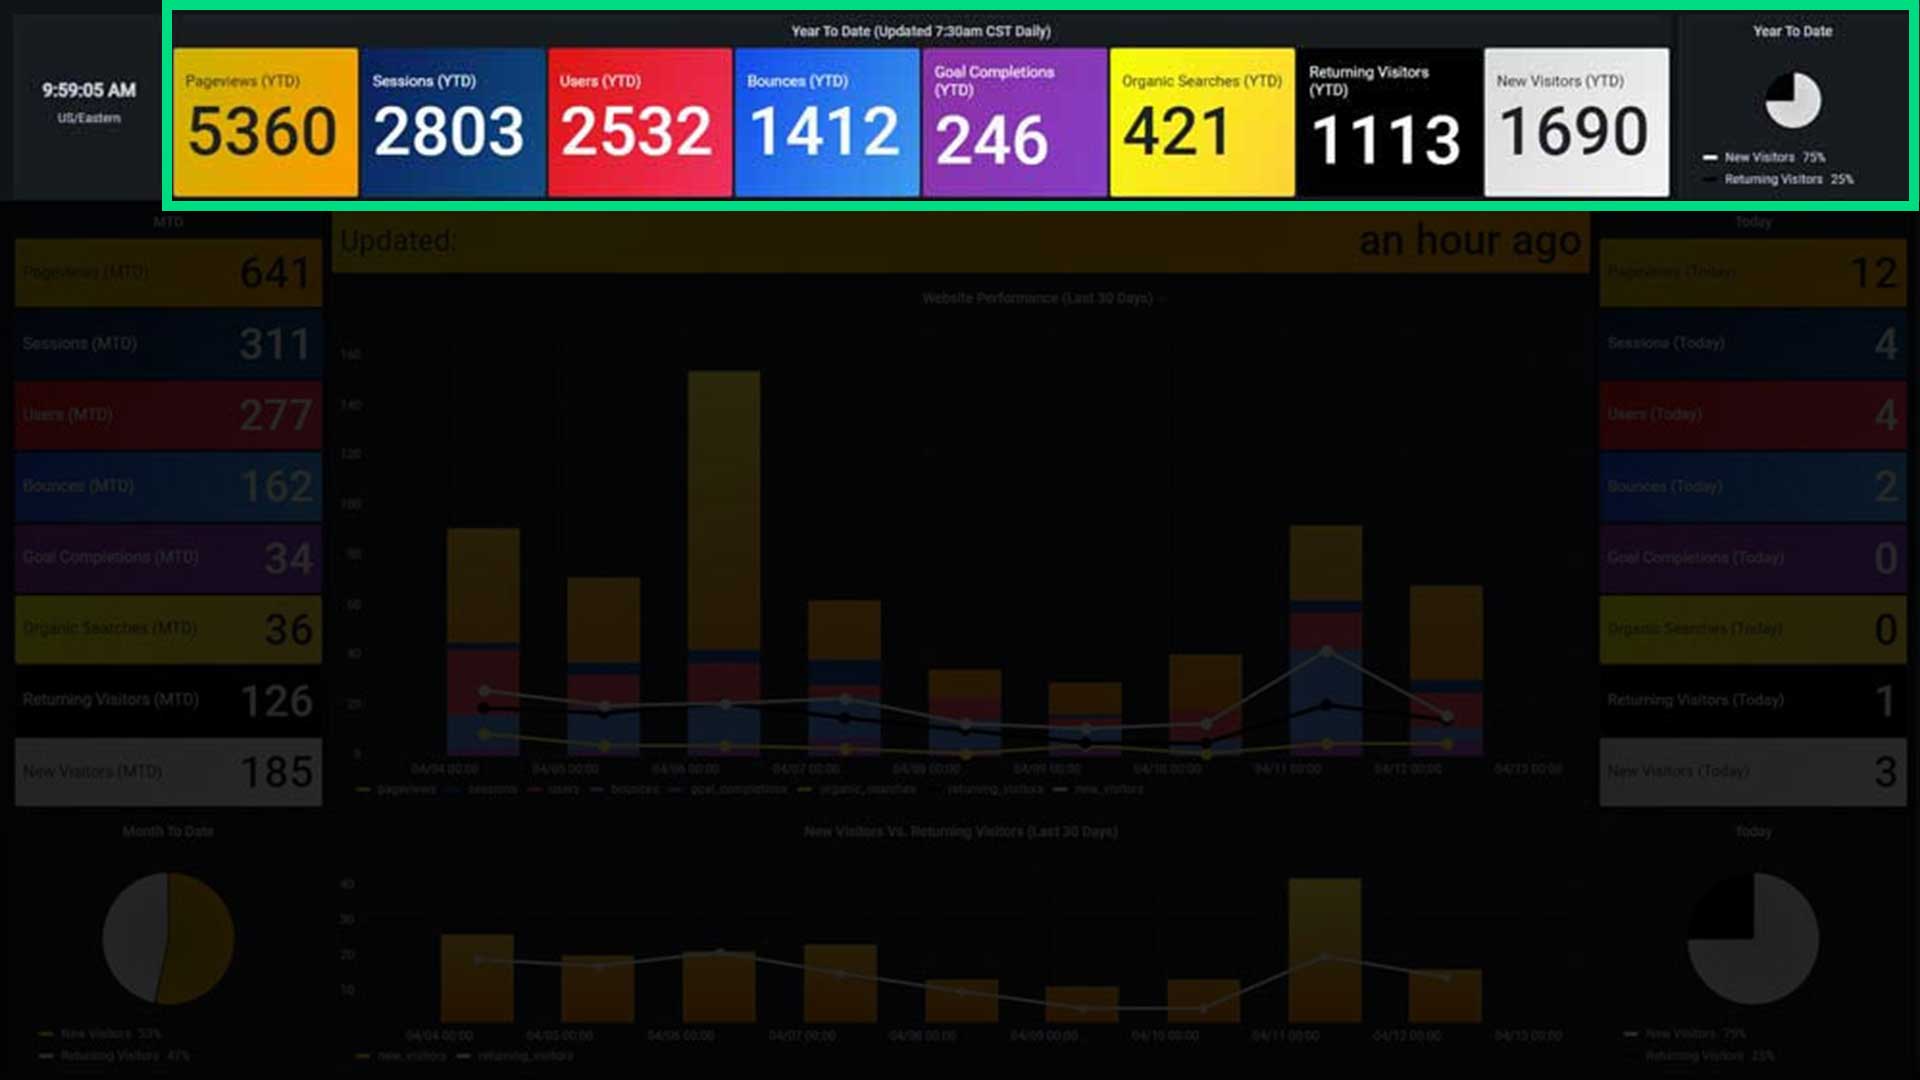
The Year-To-Date Panel
This panel totals up all metrics from the beginning of the year, giving a broad overview of your website's perfomance over a relatively long period of time.
- Pageviews (YTD)
- Sessions (YTD)
- Users (YTD)
- Bounces (YTD)
- Goal Completions (YTD)
- Organic Searches (YTD)
- Returning Visitors (YTD)
- New Visitors (YTD)
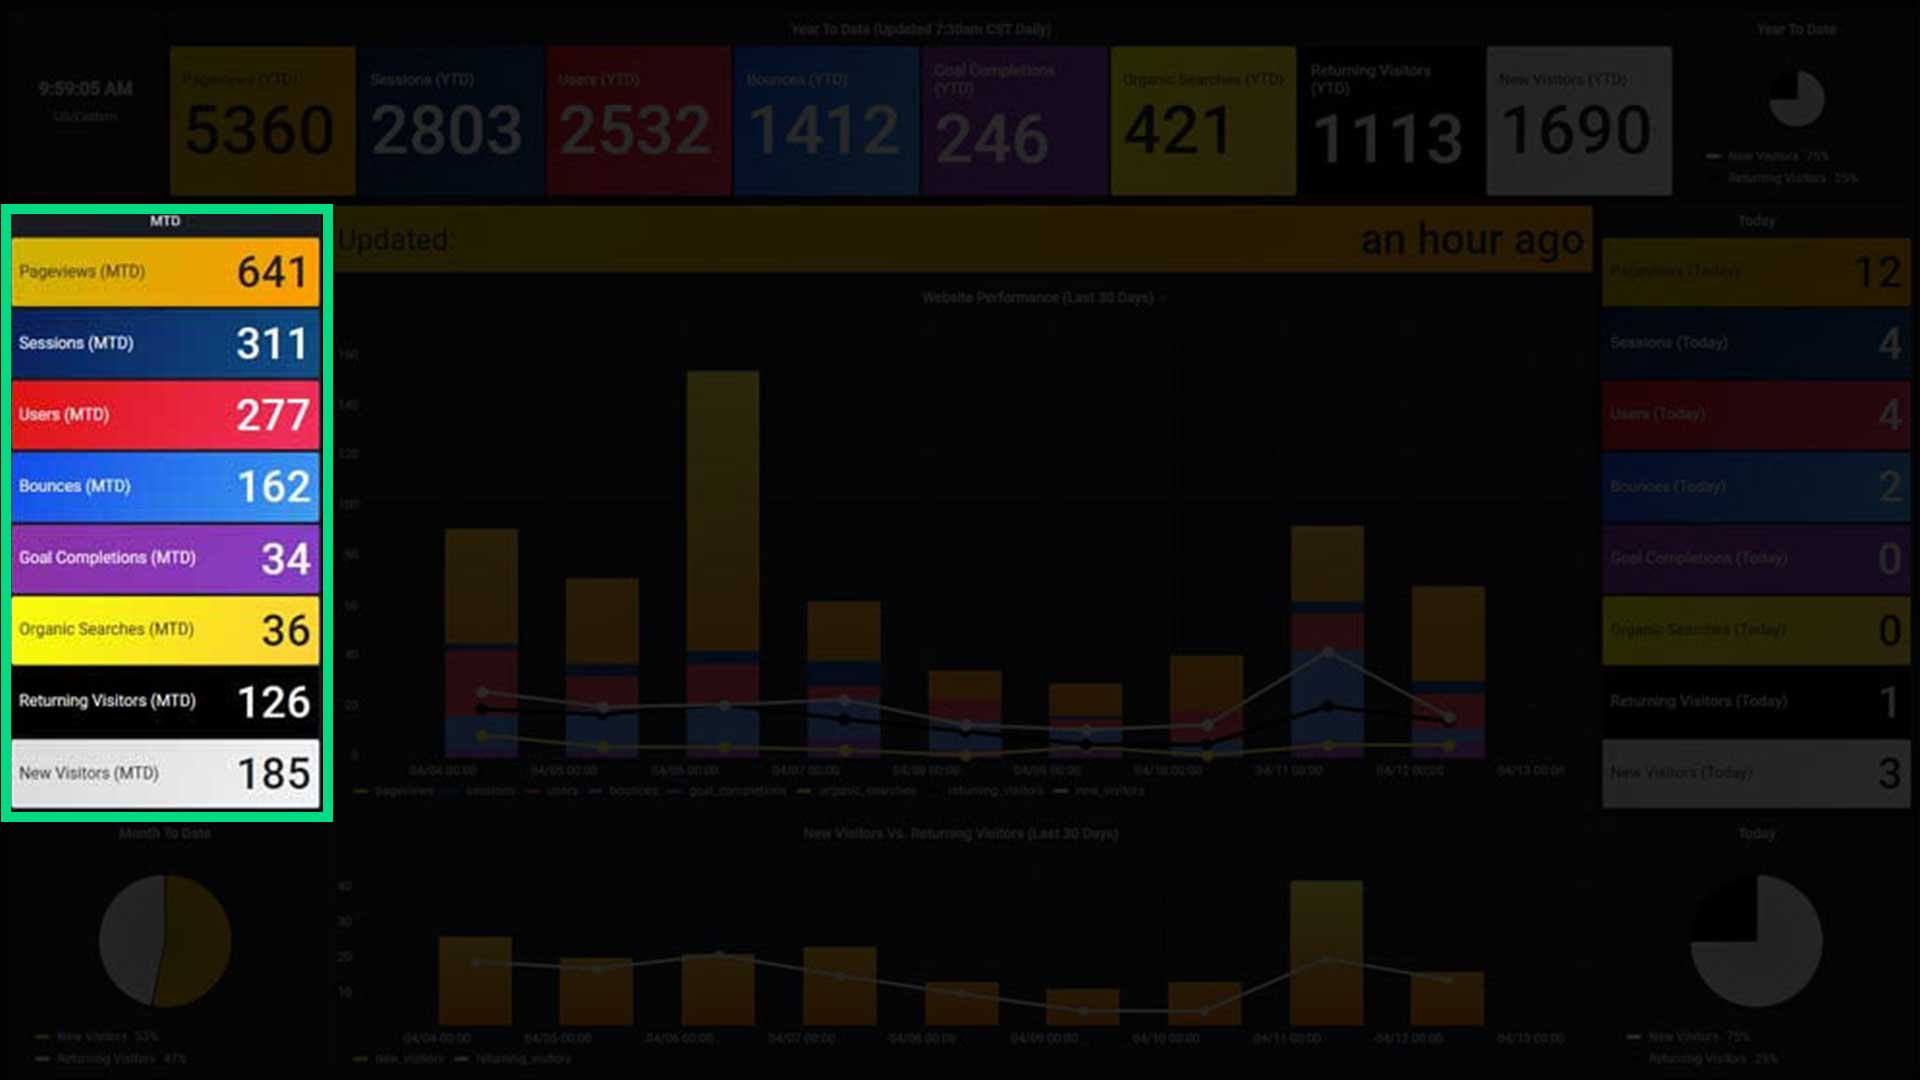
The Month-To-Date Panel
This panel totals up all metrics from the beginning of the month. Other than the timeframe, this panel is identical to the one above.
- Pageviews (MTD)
- Sessions (MTD)
- Users (MTD)
- Bounces (MTD)
- Goal Completions (MTD)
- Organic Searches (MTD)
- Returning Visitors (MTD)
- New Visitors (MTD)
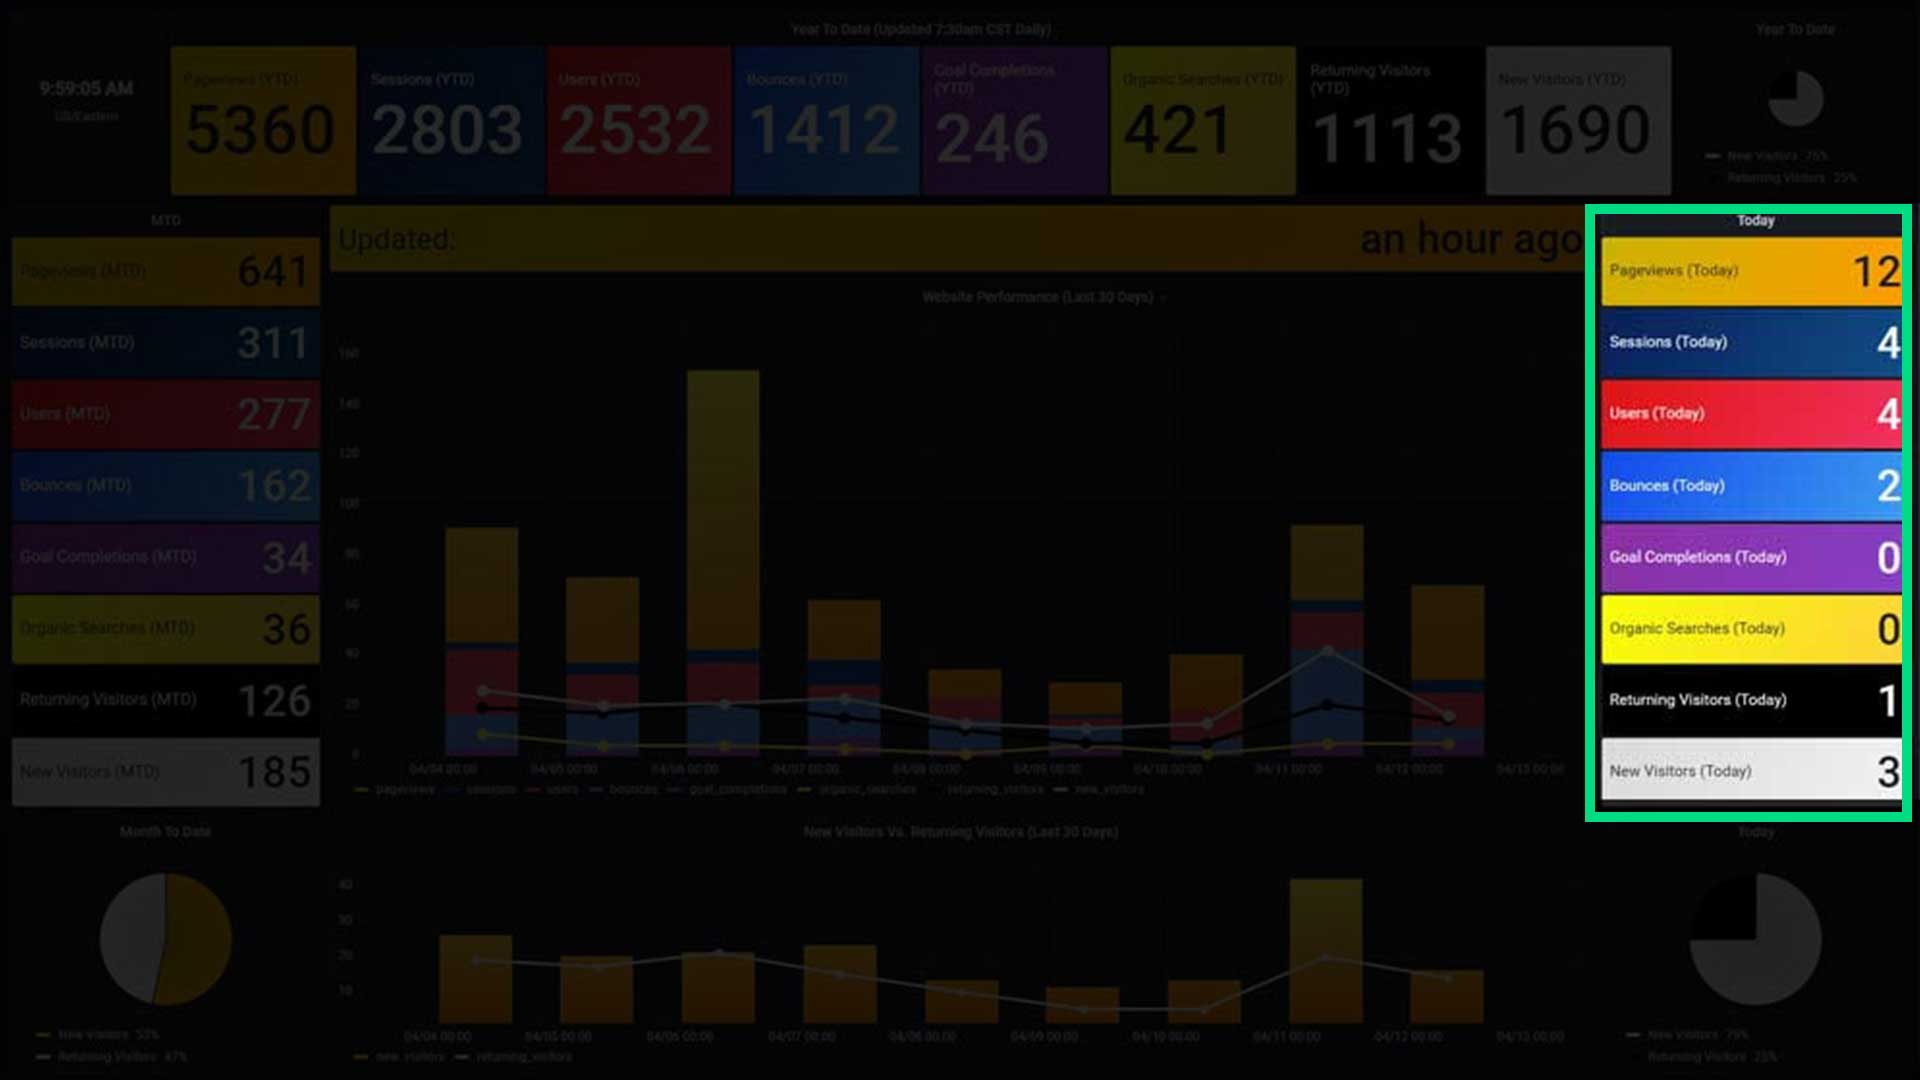
The Today Panel
The Today panel shows all metrics summed up for the current day only.
- Pageviews (Today)
- Sessions (Today)
- Users (Today)
- Bounces (Today)
- Goal Completions (Today)
- Organic Searches (Today)
- Returning Visitors (Today)
- New Visitors (Today)
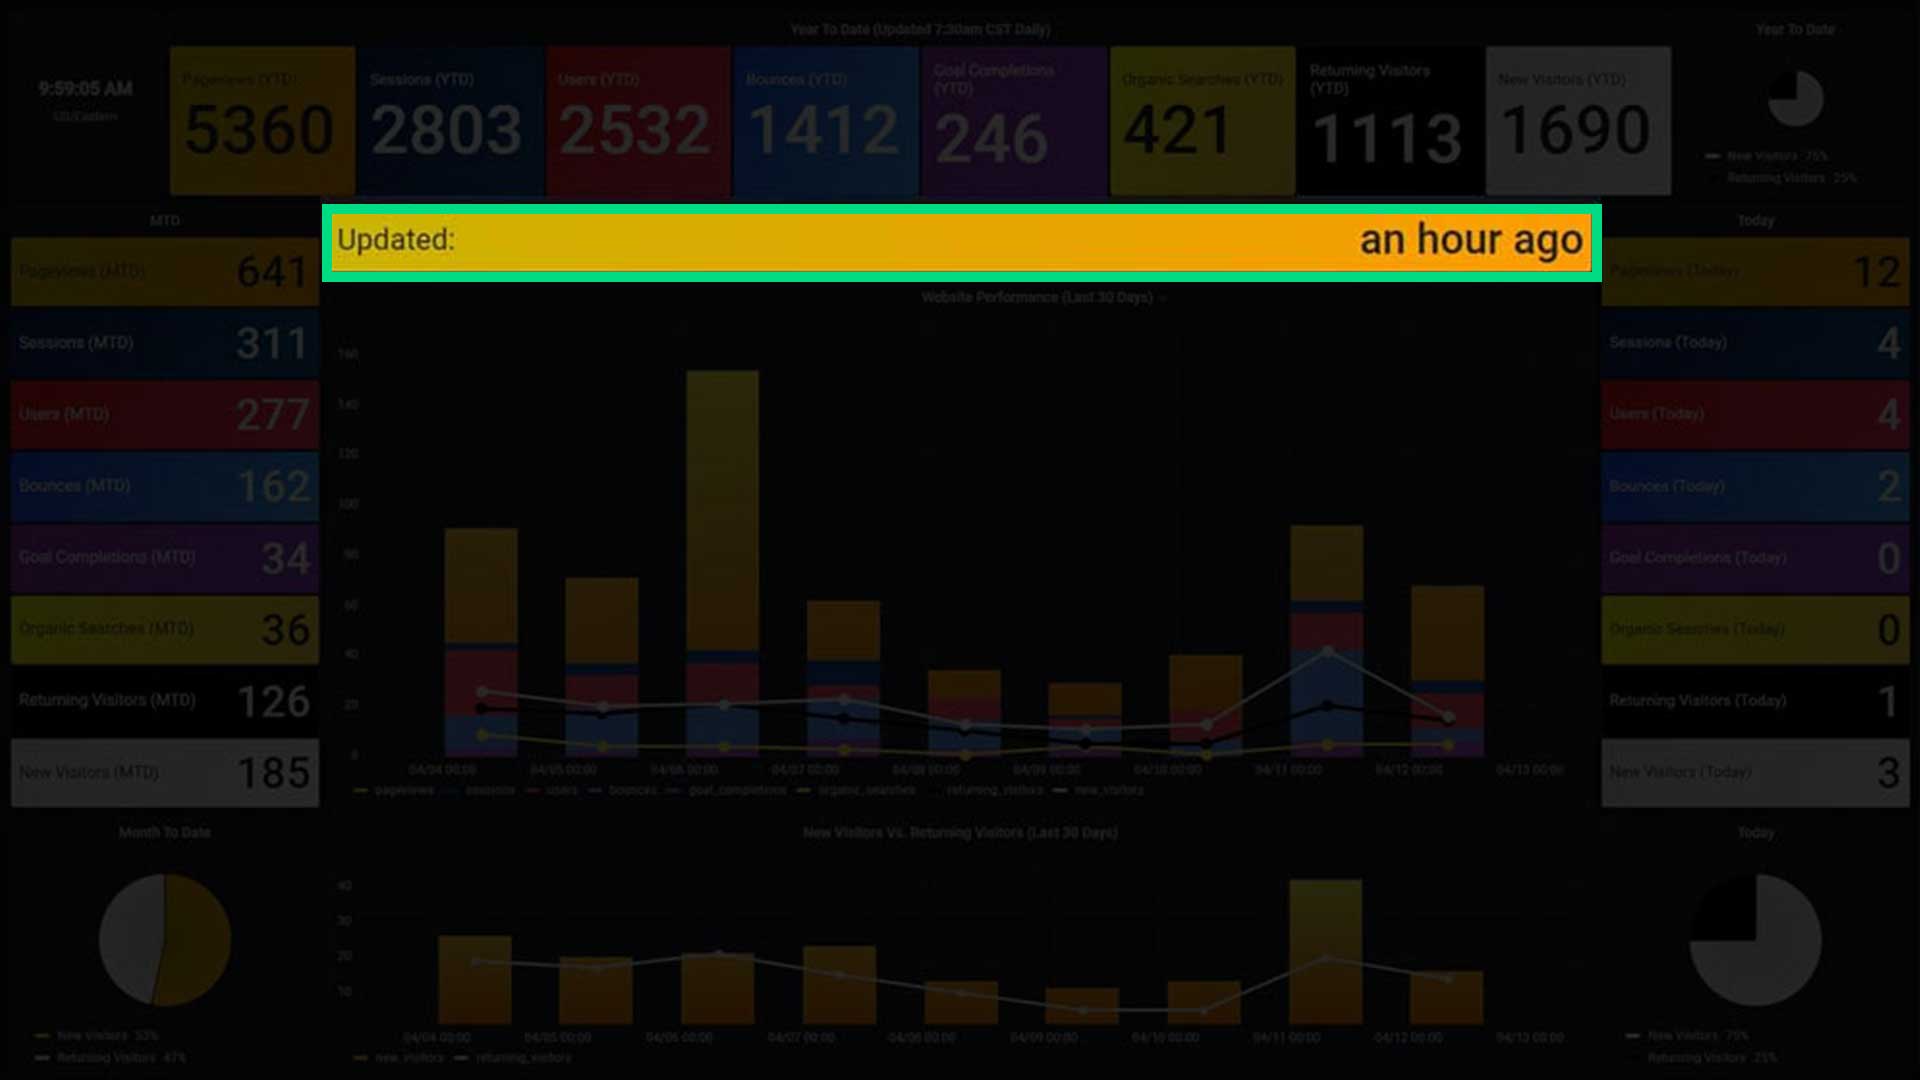
The Updated Panel
The Updated panel shows that last time that the dashboard was updated. This could be anywhere between five minutes and several hours, depending on the agreed upon fetch interval.
- Updated
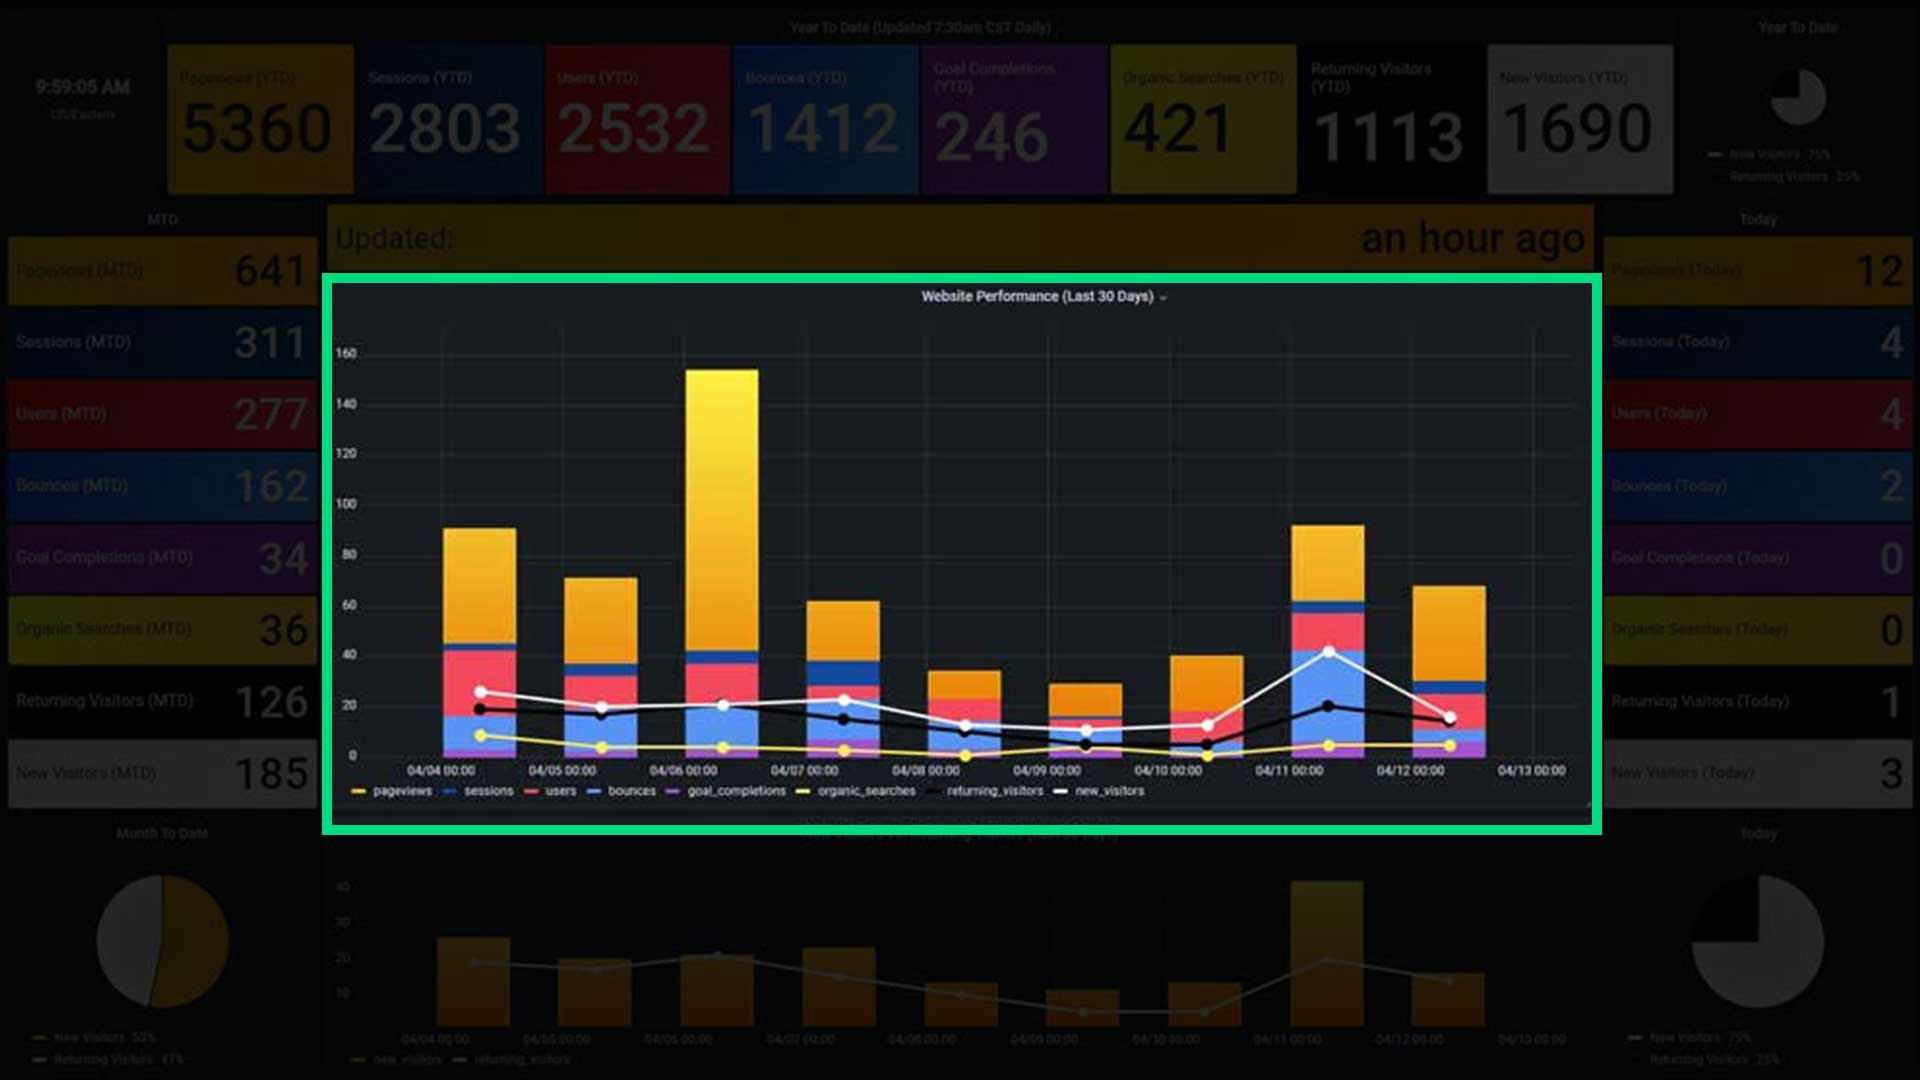
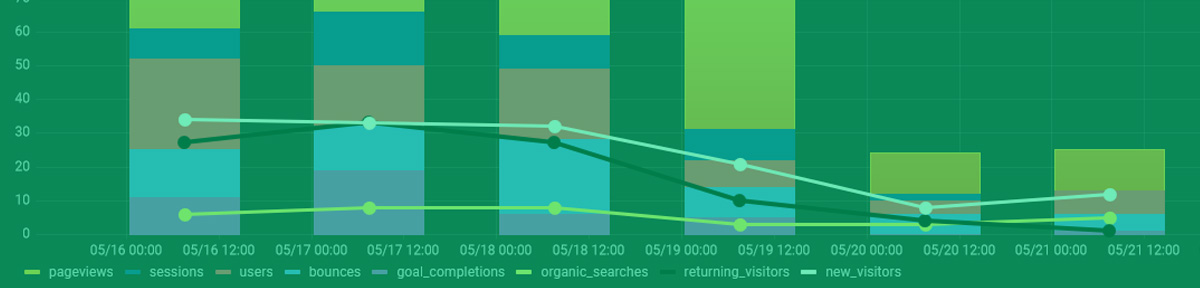
The Visitors Panel
The Today panel shows all metrics summed up and adds a timeframe context in the form of a time-series graph. This allows an observer to review website performance per day over the last seven days.
The 7 day interval can be adjusted as needed to display service level-required data. Possible intervals are anywhere from three days to one year.
- Pageviews (Last 7 days)
- Sessions (Last 7 days)
- Users (Last 7 days)
- Bounces (Last 7 days)
- Goal Completions (Last 7 days)
- Organic Searches (Last 7 days)
- Returning Visitors (Last 7 days)
- New Visitors (Last 7 days)
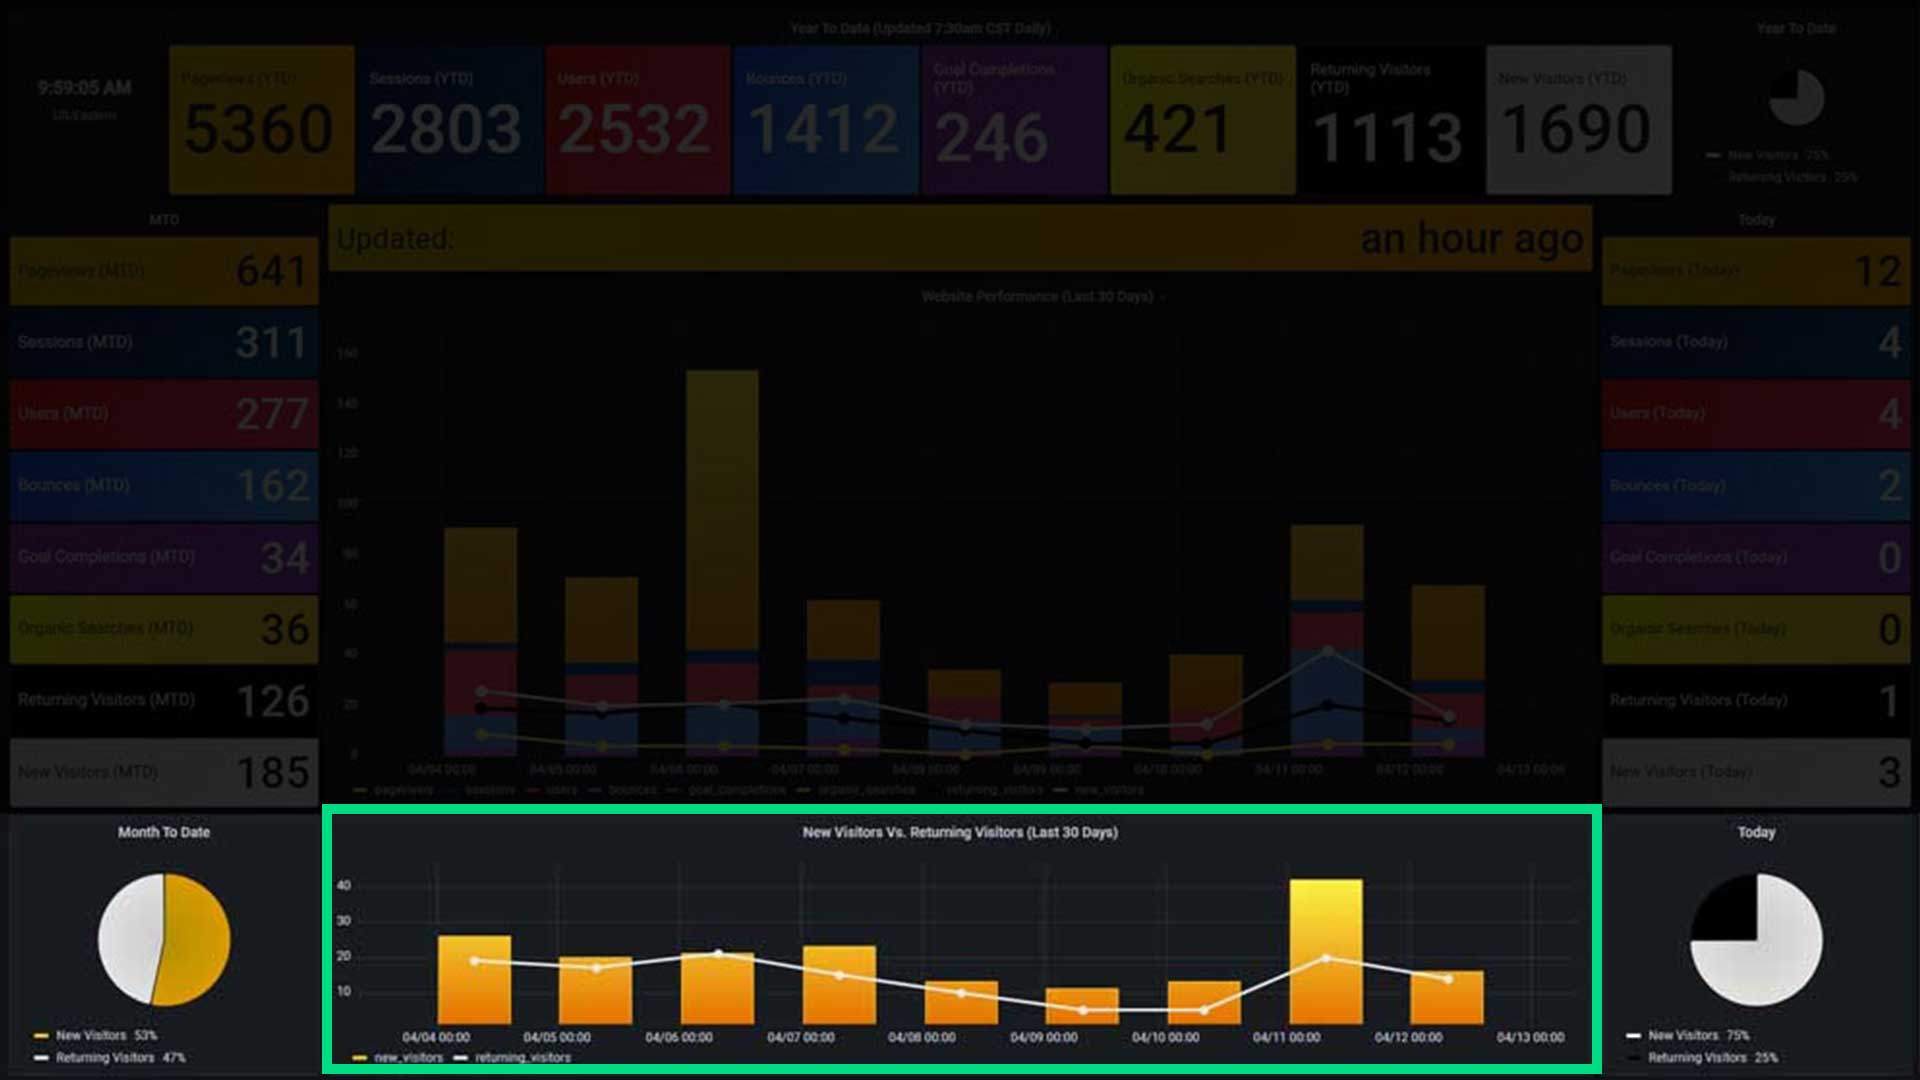
The Returning Visitors Panel
The Returning Visitors panel compares Returning Visitor versus New Visitors.
- Returning Visitors Vs. New Visitors (Month to Date)
- Returning Visitors Vs. New Visitors (Today)
- Returning Visitors Vs. New Visitors (Last 7 Days)